Contact Number: +86 4006234566




A 6,400 sq ft family entertainment center outside Columbus put $71,000 into equipment in early 2025. Weekend admission ran $16.95, weekday $12.95, socks $3.50. The equipment line cleared itself in month 15. The operator built the whole projection on a single spreadsheet tab, and it was closer to a real indoor playground ROI calculator than most of the software sold for the purpose - because it only had four inputs that mattered: what the equipment cost, how many children walked in, what each one spent, and what it cost to keep the doors open.
Most ROI models for this sector fail on the second input, not the first. Equipment pricing is knowable to within a few thousand dollars before anyone signs anything. Attendance is not.
Return on the equipment investment is the equipment cost divided by the annual cash the equipment generates, expressed as a payback period in months. That is the number lenders ask about. The full-facility ROI - including lease, build-out, fire suppression, HVAC, POS, and the first three months of payroll - is a different and larger calculation, and equipment is usually 30 to 45 percent of it.
Four inputs carry the model:
Payback in months = equipment capital / ((revenue per child - operating cost per child) x monthly entries). It is arithmetic. The difficulty sits entirely in the honesty of the assumptions.
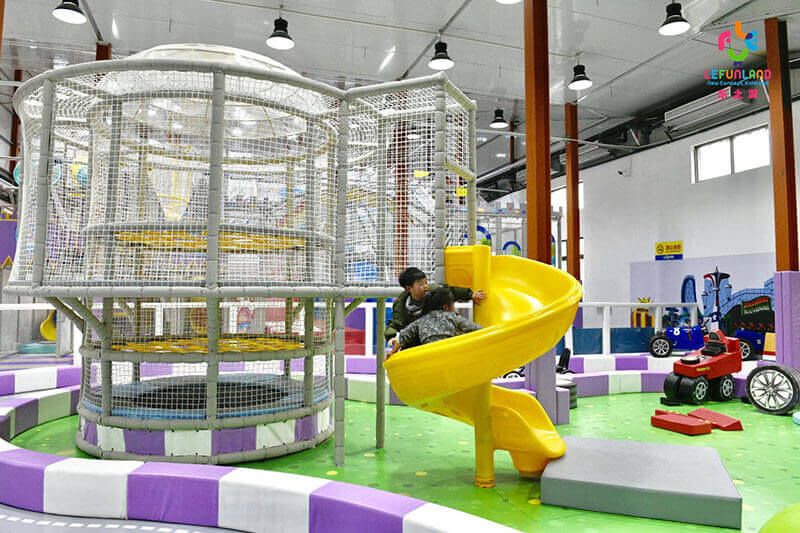
A mid-size FEC floor. Equipment capital is the denominator in every indoor playground ROI calculation; attendance is the variable that moves.
Per-sq-ft pricing is not flat across facility sizes, and the direction surprises people. Smaller projects cost more per square foot, not less.
The reason is density. A 3,500 sq ft fit-out has to carry structure across nearly every usable foot to feel worth the admission price, so it quotes at the top of the range or slightly above. A 12,000 sq ft center intentionally leaves 35 to 45 percent of the floor to walk zones, seating, party rooms, and sightlines for supervising parents. Lower equipment density, lower per-sq-ft cost. Both are correct for their context. They produce different numbers on the quote, and an ROI model that assumes one flat rate across sizes will be wrong at both ends.
| Facility size | Equipment capital, factory-direct | Typical equipment density |
|---|---|---|
| Under 5,000 sq ft | $15,000 - $75,000 | High - most of the floor carries structure |
| 5,000 - 10,000 sq ft | $50,000 - $150,000 | Moderate - dedicated toddler and party zones appear |
| 10,000+ sq ft | $100,000 - $300,000+ | Lower - circulation and seating take real floor area |
Those brackets are equipment only. They do not include freight, customs, or installation labor, and they do not include the build-out items that a landlord or a fire marshal will require regardless of what the play structure costs. A fuller breakdown sits in the indoor playground equipment cost guide.
Admission alone rarely carries an FEC. Across the sector, ticket revenue typically lands somewhere between 55 and 70 percent of total revenue in a facility that is running well, with the balance coming from food and beverage, birthday parties, memberships, and retail. Facilities that sit at 90 percent admission usually have a payback period two to three times longer than the ones with a working party program, because parties convert one paid child into eight to fifteen at a higher per-head rate on the slowest hours of the week.
Revenue per child in a US suburban market commonly runs $14 to $26 all-in. The spread is not mostly about ticket price. It is about whether the floor plan gives parents somewhere to sit and buy coffee, and whether the party rooms are separated from the general admission noise. Layout decisions made at the design stage set the ceiling on the attach rate for the life of the lease. There is more on that in the revenue streams breakdown and in the wider view of how profitable an indoor playground actually is.
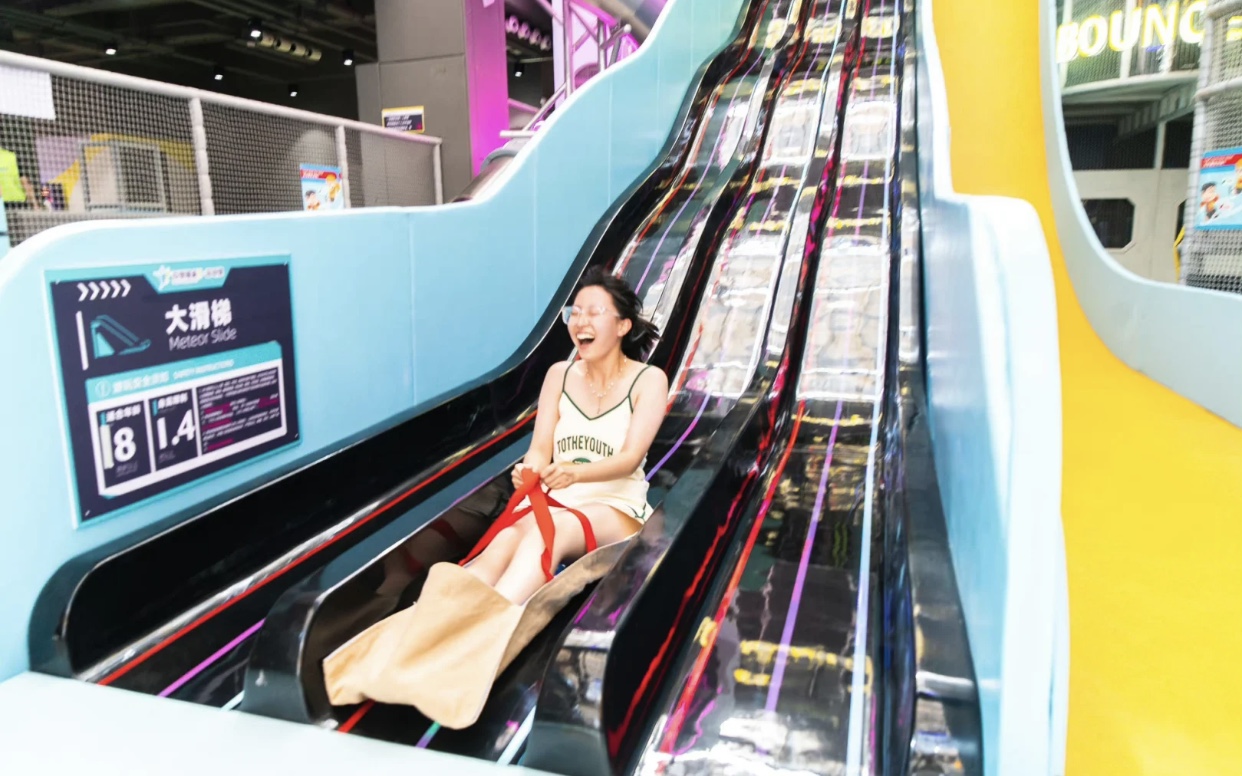
Party rooms and seated parent zones move the attach rate, which moves payback faster than admission price does.
The following are sector-typical modeling ranges, not guarantees. They assume factory-direct equipment, a suburban US market, and a facility open seven days.
| Scenario | Equipment capital | Monthly paid entries | Net contribution per entry | Equipment payback |
|---|---|---|---|---|
| 3,500 sq ft neighborhood play cafe | $48,000 | 1,400 | $6 - $8 | 6 - 9 months |
| 7,000 sq ft mid-size FEC | $96,000 | 2,600 | $7 - $10 | 5 - 8 months |
| 13,000 sq ft large FEC | $185,000 | 4,500 | $8 - $12 | 4 - 7 months |
Equipment payback looks fast in isolation. It should. Equipment is the smaller share of total capital and the piece that directly generates the admission. Full-facility payback across the same three scenarios more commonly runs 22 to 40 months once lease deposits, build-out, and the ramp period are in the denominator. Anyone modeling a 14-month full-facility payback has probably left the ramp out - the first four to six months rarely hit steady-state attendance, and a model that starts at month-one maturity overstates year-one cash by a wide margin. A business plan template that separates equipment payback from facility payback keeps the two from being confused in front of a lender.
Replacement timing sits outside most spreadsheets, and it is the single largest hidden variable in a five-year return.
Equipment built on 40mm x 1.5mm tube with 40 to 60 micron powder coating and 40 to 50 density foam looks identical to heavier commercial spec on opening day. Children cannot tell. Parents cannot tell. The difference appears in the operator's P&L somewhere around month 24, first as wobble at the joints, then as coating wear at the contact points, then as foam that has taken a compression set and stopped protecting anything. Lefunland builds to 48mm x 2.2mm steel, 80+ micron coating, 80-density EVA, and 0.45mm PVC, and that spec choice is what decides whether the depreciation schedule in the ROI model runs seven years or three.
Run the arithmetic on that. Equipment quoted 15 percent below the commercial-spec price but replaced in year four is not 15 percent cheaper across a seven-year lease. It is close to twice the price, plus the closed weeks during replacement, plus whatever the reputation cost of a tired-looking floor does to repeat visits. Repeat visits are where the model lives or dies - an FEC that converts 40 percent of first visits into second visits has an entirely different revenue curve from one converting 15 percent, on the same equipment capital.
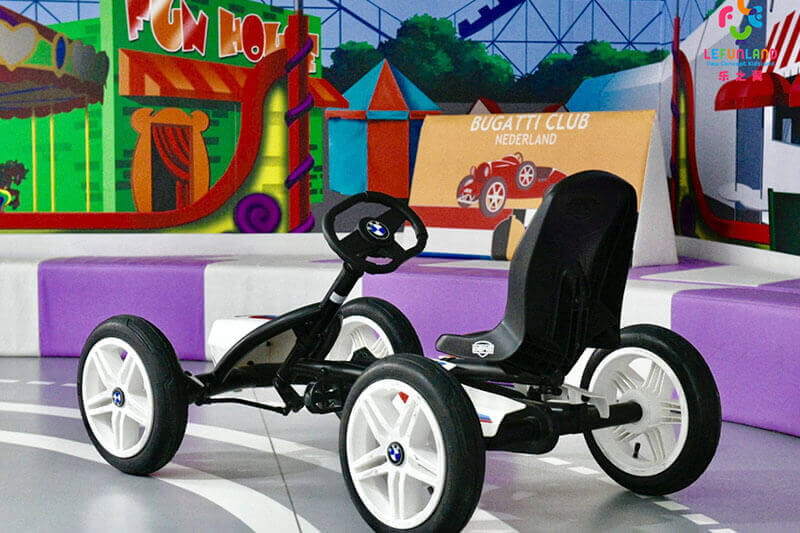
Material spec sets the depreciation schedule. A seven-year asset and a three-year asset can look the same at handover.
Five numbers from any quote change the ROI math directly: steel tube diameter and wall thickness, powder coating thickness in microns, EVA foam density, PVC covering thickness, and what the warranty covers in writing rather than in a logo. Those five determine the replacement year in the model. The freight, customs, and installation lines determine the true capital number, which is often 12 to 20 percent above the equipment quote for an imported project.
Lefunland has been manufacturing since 2009 - 16+ years, 3,000+ projects delivered in 60+ countries, from a 70-acre facility in Dongyang, Zhejiang. The company is a principal drafting unit for China's national amusement equipment standards and operates an SGS-authorized testing laboratory that can test and issue inspection reports for the wider amusement equipment industry. Production lead time is 45 days.
If you want equipment capital, freight, and installation modeled against your actual square footage and market, send the floor plan and the target opening date. You will get a 3D design and a factory-direct quote with the five spec numbers written into it, so the payback period in your model is built on the real replacement horizon.
Email: contact@lefunland.com
WhatsApp: +8613605727866
Copyright 2018-2026 © ShangHai Lefunland Children's Products Co.,Ltd. All Right Reserved
